(C) Copyright 2025 - ECMWF and individual contributors.
This software is licensed under the terms of the Apache Licence Version 2.0
which can be obtained at http://
POF Plotter
Importing all the necessary python libraries
import matplotlib
import matplotlib.pyplot as plt
from matplotlib import colors
from matplotlib import cm
from matplotlib.colors import Normalize
import numpy as np
import xarray as xr
import matplotlib as mpl
from cartopy import config
import cartopy.crs as ccrs
import cartopy as cart
import sys
import datetime
from matplotlib.colors import ListedColormap,LinearSegmentedColormap
Open Prediction Netcdf
year=2019
month=12


fire= xr.open_dataset(f"./outputs/POF_prediction_{year}_{month:02d}.nc")
fire = fire.assign_coords(longitude=((fire.longitude + 360) % 360)).sortby('longitude')
lats = fire.latitude.values
lons = fire.longitude.values
fire
Loading...
Define a subregion to plot
lat1 = -10
lat2 = -45
lon1 = 110
lon2 = 155

sub_ds = fire.sel(
    latitude=slice(lat1, lat2),
    longitude=slice(lon1, lon2)
)

sub_ds
Loading...
Create colour pallete
cols = ['#4a5a60','#edcc00','#edcc00','#e57d0f','#e57d0f','#e57d0f','#e57d0f','#e57d0f','#e57d0f','#e21819','#e21819','#e21819','#e21819','#e21819','#000000','#000000']
test = ListedColormap(cols)
Define levels
index=0 # Which index to plot (1st of the month)
fires = sub_ds.fire_probability[index].values
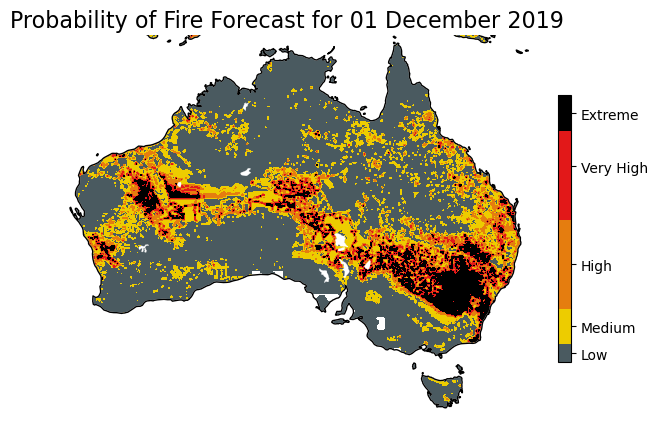
plot_title = f"Probability of Fire Forecast for {sub_ds.time.values[index].strftime('%d %B %Y') }"
fires[fires>0.006]=0.006 # 1km
levels = np.arange(16)/2500 # 1km
print(np.shape(fires))
print(np.nanmax(fire.fire_probability.values))
print(np.nanmin(fire.fire_probability.values))
print(np.nanmean(fire.fire_probability.values))(350, 451)
0.7821691036224365
7.712809946269772e-08
0.00037181633024126437
Plot
ax = plt.axes(projection=ccrs.PlateCarree())
ax.coastlines(linewidth=1)

fig = ax.contourf(sub_ds.longitude, sub_ds.latitude, fires,levels=levels,vmin=0,vmax=0.006,transform=ccrs.PlateCarree(),cmap=test)

ax.add_feature(cart.feature.OCEAN,zorder=1,edgecolor='k',color='white')
ax.add_feature(cart.feature.BORDERS,linewidth=0.5,color='white')
ax.add_feature(cart.feature.LAKES,color='white', edgecolor='k', linewidth=0.2, zorder=2)

states_provinces = cart.feature.NaturalEarthFeature(
        category='cultural',
        name='admin_1_states_provinces_lines',
        scale='50m',
        edgecolor='black'
)

for spine in ax.spines.values():
   spine.set_visible(False)

cbar = plt.colorbar(fig,ticks=[0.0002,0.0008,0.0022,0.0044,0.0056],fraction=0.025, pad=0.04)
cbar.ax.set_yticklabels(['Low', 'Medium','High', 'Very High', 'Extreme'])

plt.title(plot_title, fontsize=16)

plt.tight_layout()

plt.savefig('./outputs/My_PoF_Plot.png', dpi=300)
/opt/homebrew/Caskroom/miniforge/base/envs/POF_BOOK/lib/python3.14/site-packages/cartopy/mpl/feature_artist.py:143: UserWarning: facecolor will have no effect as it has been defined as "never".
  warnings.warn('facecolor will have no effect as it has been '
/opt/homebrew/Caskroom/miniforge/base/envs/POF_BOOK/lib/python3.14/site-packages/cartopy/io/__init__.py:242: DownloadWarning: Downloading: https://naturalearth.s3.amazonaws.com/50m_physical/ne_50m_lakes.zip
  warnings.warn(f'Downloading: {url}', DownloadWarning)